Chart types
Charts help you visualize your data in a way that creates maximum impact on your business. Each chart type serves a specific purpose and is suitable for different types of data. In Command Center You can find the following types of charts and their relative usage in achieving your data visualization goal:
Card
To display a relevant piece of data or a KPI in a concise and easily digestible format. Used to highlight key metrics or information, providing a quick overview. Example: Displaying the current stock price of a company or the total revenue for the current quarter in a small, easily digestible card.
Pie Chart
To examine part-to-whole relationships with simple proportions. Suitable for categorical data (divided into categories). Example: Market share distribution, illustrating the percentage contribution of different product categories. 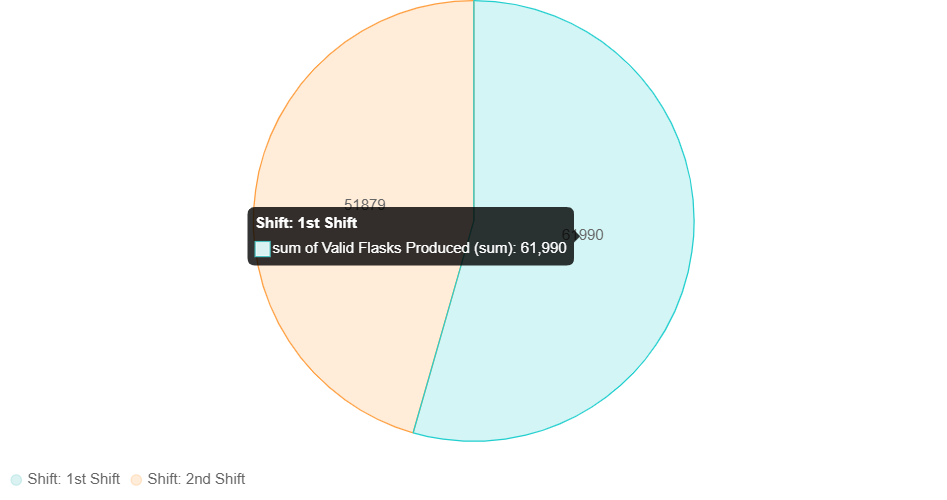
Vertical bar Chart
To compare values across ordered categories, including comparisons among different variables (ordinal variables). Example: Comparing sales figures of different products in a store. Where each vertical bar represents the sales performance of a specific product, and the height of the bar corresponds to the sales amount. 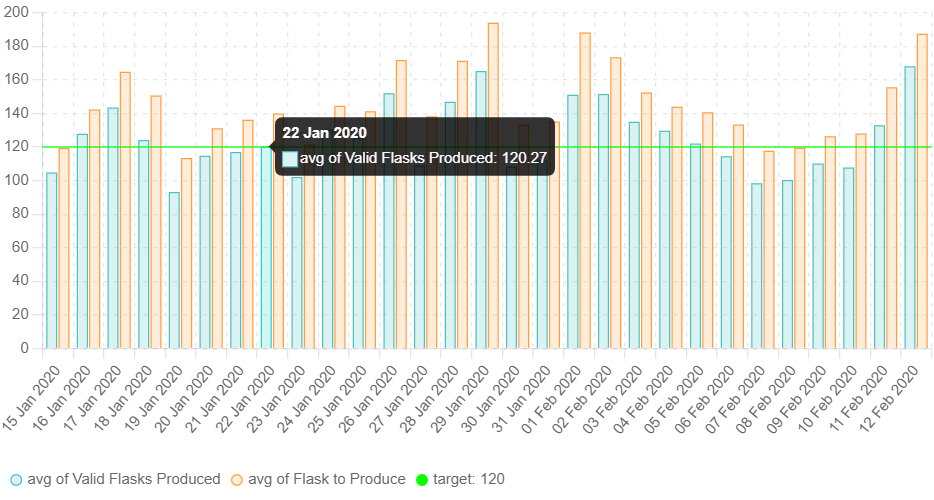
Horizontal bar Chart
To compare values across not ordered categories, including comparisons among different variables (nominal variables). Example: Comparing the market share of different smartphone brands. Each horizontal bar represents a brand, and the length of the bar corresponds to its market share percentage. 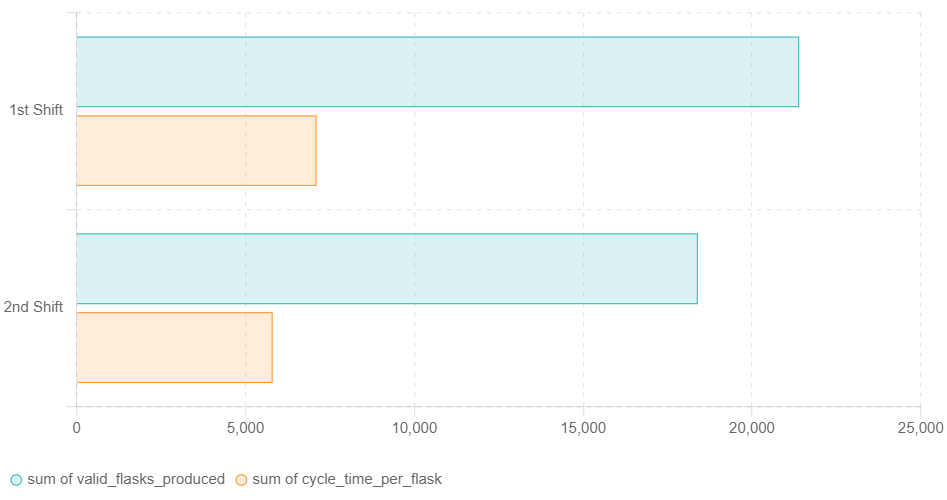
Doughnut Chart
To examine part-to-whole relationships with simple proportions. Suitable for numerical data (measured data). Example: Visualizing budget allocation, showcasing the distribution of expenses across various categories. 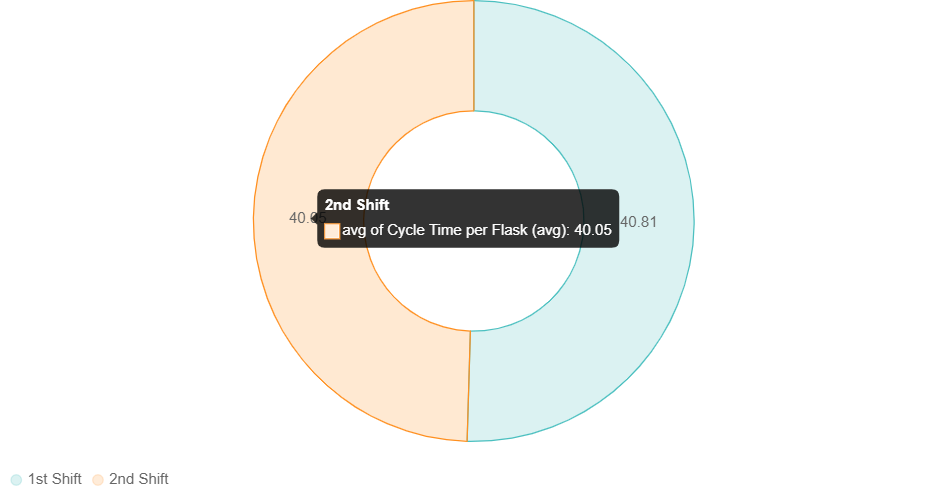
Line Chart
To illustrate trends and enable comparisons of values over time. Example: Trend analysis, showing changes in stock prices over time. 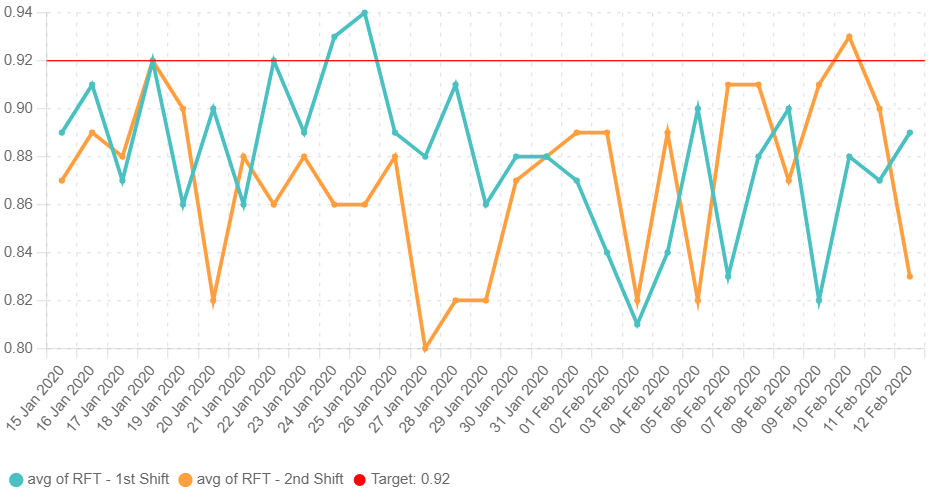
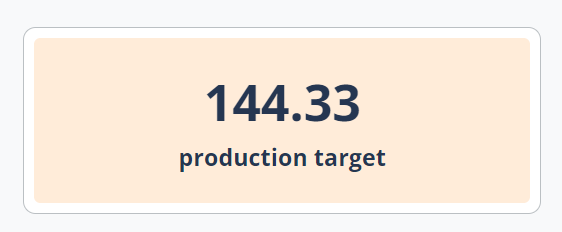
Gauge
To display a single value of data in a quantitative way, providing insight into the progress of a Key Performance Indicator (KPI) against a set target. Example: Monitoring progress towards a goal. 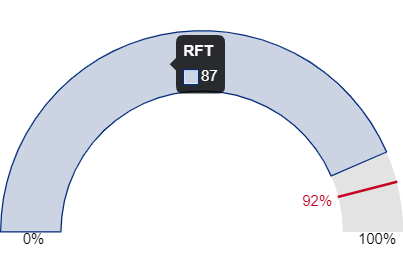
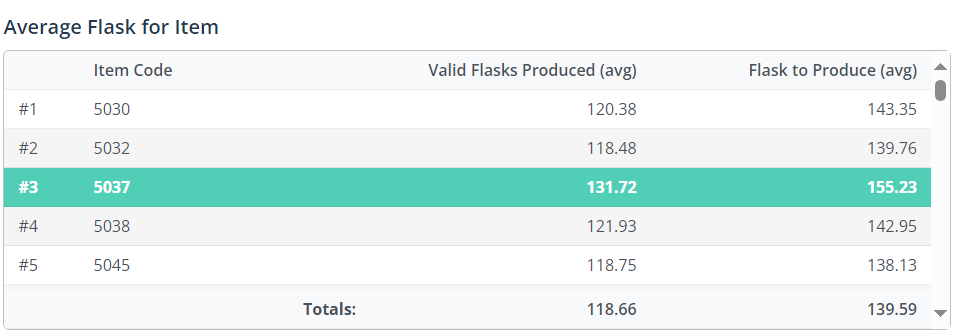
Table
To display summary statistics (count, average, sum, max, min, variance) of one variable in relation to another. Example: Displaying detailed information such as sales data for different products, including columns for product name, quantity sold, and revenue generated.
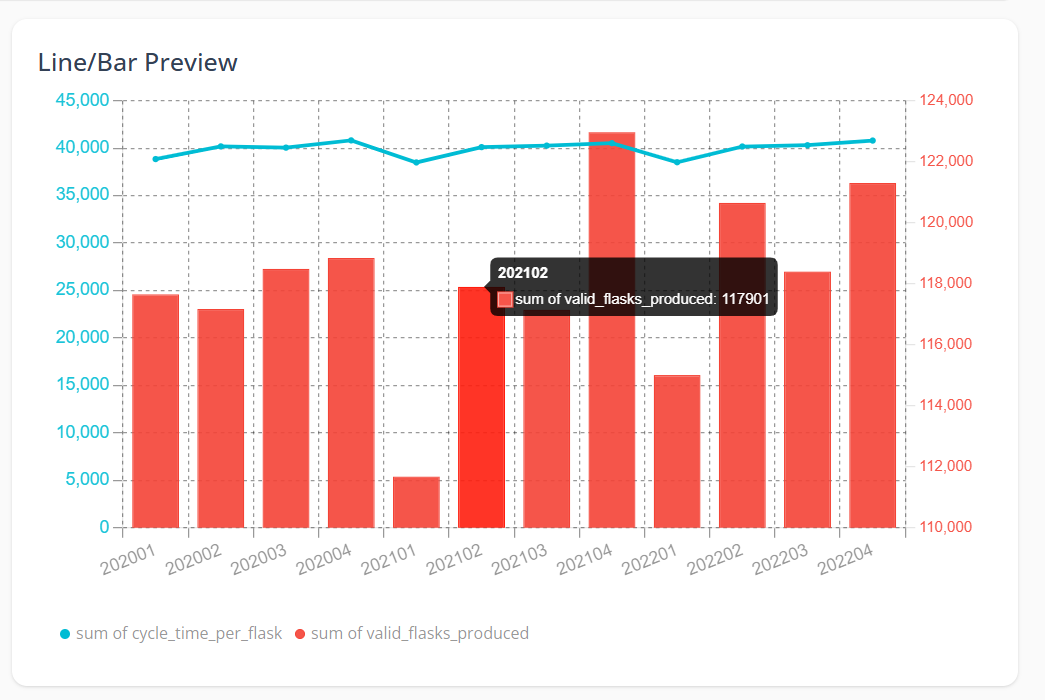
Line/Bar
A Line/Bar chart combines the features of Line and Bar charts in a single visualization. Line is used to illustrate trends and enable comparisons of values over time. Bar is used to compare quantities across categories or time periods. This chart type is particularly useful when you want to see both absolute values (bars) and their evolution or trend (line) on the same graph. Example: Comparing production volume with process efficiency at the same time, identifying correlations and anomalies.