Monitoring Chart Types
Monitoring Charts provide a clear, real-time view of data, enabling users to make fast and informed decisions. Each chart type is designed for a specific purpose and performs best with certain kinds of data.
Within the Command Center, users can access several types of Monitoring Charts, along with guidance on when and how each type should be used to gain the most value from real-time data.
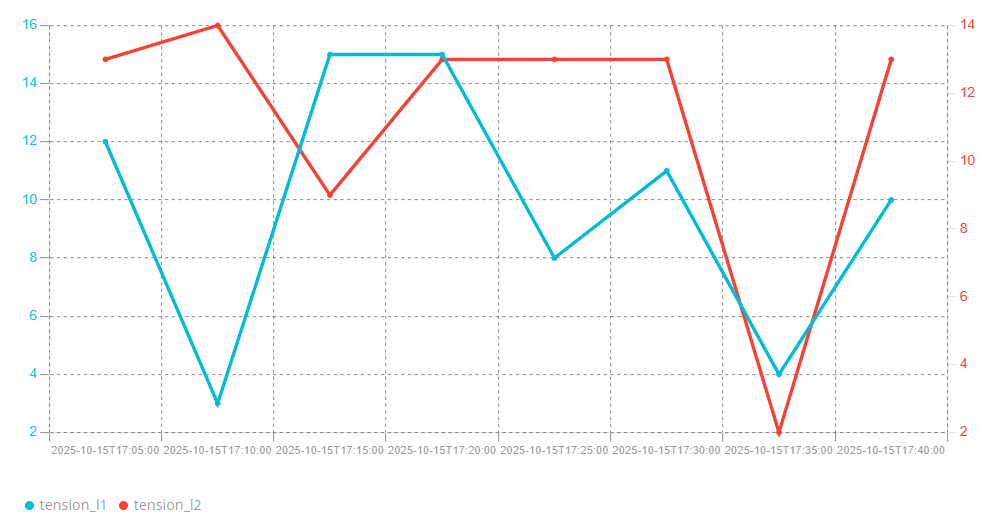
Monitoring Line chart
The Line Chart is used to track real-time trends and monitor how values change over time. It provides a clear visualization of continuous data, allowing users to identify fluctuations and patterns as they occur. Example: Monitoring server CPU or memory usage, tracking live sensor, observing real-time sales or performance metrics.