Add charts from chart library
To create a Dashboard select the charts from the Chart Library.
Before you begin, verify you have created chart, accessible in the Charts > Charts Library section.
- Log in Command Center Console as Admin/SuperAdmin
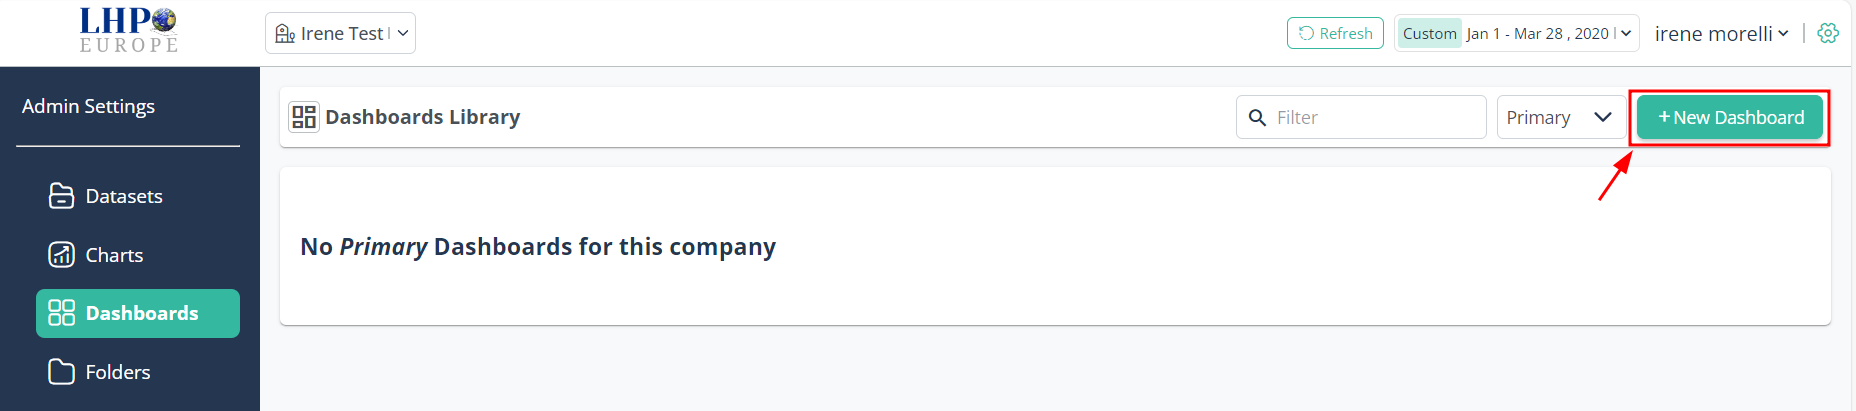
- From the Menu bar select Dashboards
- Click on + New Dashboard button
 Then a dashboard creation page opens
In Charts section you can find previously created charts, by typing in Search field, a title of the chart or by scrolling the pages
Select the time range from the dropdown to specify the period to which the dashboard applies. Click on Apply button to confirm your selection
There are several options to add a chart to the dashboard:
a) Clicking on + Add on the dashboard page: click on + Add button to add a chart and a new empty folder appears, then click on a chart in Charts list
b) Clicking on a chart in Charts list
INFO
The Command Center allows adding charts created with different datasets to the same dashboard.
Chart is on a Dashboard!